Your TikTok video just hit 100,000 views. Sounds impressive, right?
But here’s the thing: without knowing your engagement rate, that number tells you almost nothing about how well your content performs.
TikTok engagement calculation isn’t just another vanity metric to obsess over. It’s the difference between creating content that resonates and shouting into the void.
Whether you’re a creator trying to land brand deals or a marketer justifying your social media budget, understanding how to calculate and interpret engagement rates separates the amateurs from the pros.
Let’s cut through the confusion and break down exactly how TikTok engagement calculation works, why it matters more than follower count, and how to use these insights to grow your account (or find partners).

Key Takeaways
- TikTok engagement rate measures how actively your audience interacts with your content, calculated by dividing total engagements by views or followers and multiplying by 100
- A good TikTok engagement rate typically ranges from 3-9%, though this varies significantly based on follower count and niche
- Multiple calculation methods exist, including engagement by views (most accurate), engagement by followers, and engagement by reach
- Tracking engagement rates over time reveals content performance trends and helps identify what resonates with your audience
- Use our free calculator below to instantly measure your TikTok engagement and benchmark against industry standards
What Is TikTok Engagement Rate and Why Does It Matter?
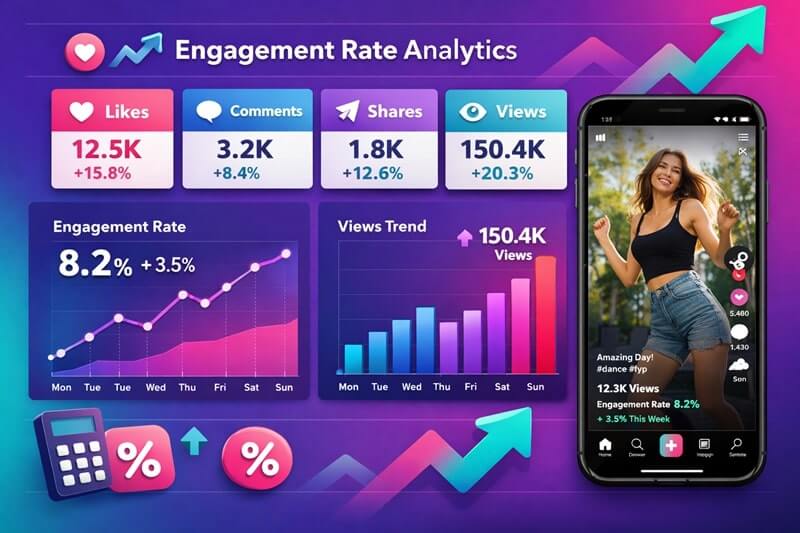
TikTok engagement rate measures how much your audience cares about your content. It’s a percentage that shows how many people interact with your videos compared to how many people see them.
Think of it this way: You could have a million followers, but if nobody likes, comments, or shares your videos, those followers are worthless. That’s why brands and savvy creators focus on engagement over follower count.
The Real Value of TikTok Engagement Calculation
Engagement rate tells you three critical things:
Content quality. High engagement means your content resonates with the intended audience. Low engagement? Time to rethink your strategy.
Audience authenticity. Real followers engage. Bots don’t. A low engagement rate with a high follower count screams fake audience.
Monetization potential. Brands don’t pay for followers anymore. They pay for engagement. A micro-influencer with 10,000 followers and 8% engagement gets better deals than someone with 100,000 followers and 1% engagement.
According to industry data, TikTok consistently shows higher engagement rates than Instagram or Facebook, making it a goldmine for creators who understand how to measure and optimize their performance.
When you’re creating short-form video content, engagement metrics become your north star for what’s working and what’s not.
How to Calculate TikTok Engagement Rate: The Three Main Methods
TikTok engagement calculation isn’t one-size-fits-all. Different methods serve different purposes. Let’s break down the three most common approaches.
Method 1: Engagement Rate by Views (Most Accurate)
This is the gold standard for TikTok because the platform is discovery-driven. Most of your views come from the For You Page, not your followers.
Formula:
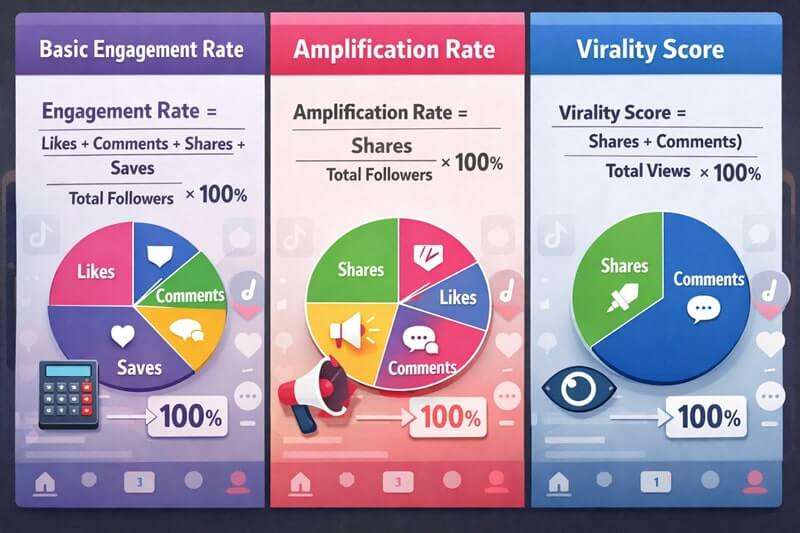
Engagement Rate = (Total Engagements ÷ Total Views) × 100Total Engagements = Likes + Comments + Shares + Saves
Example:
- Views: 50,000
- Likes: 4,000
- Comments: 200
- Shares: 150
- Saves: 50
- Total Engagements: 4,400
- Engagement Rate: (4,400 ÷ 50,000) × 100 = 8.8%
This method gives you the clearest picture of how compelling your content is to everyone who sees it, regardless of whether they follow you.
Method 2: Engagement Rate by Followers
This traditional method compares engagement to your follower count. It’s useful for tracking how well you activate your existing audience.
Formula:
Engagement Rate = (Total Engagements ÷ Follower Count) × 100Example:
- Followers: 25,000
- Total Engagements on a video: 4,400
- Engagement Rate: (4,400 ÷ 25,000) × 100 = 17.6%
Notice how this number is higher? That’s because your followers are more likely to engage than random viewers. This metric helps you understand follower loyalty.
Method 3: Engagement Rate by Reach
Reach shows unique viewers, which differs from views (one person can watch your video multiple times). This method is harder to calculate since TikTok doesn’t always display reach data publicly.
Formula:
Engagement Rate = (Total Engagements ÷ Reach) × 100This gives you the most conservative estimate and is particularly useful when analyzing campaign performance.

Which Method Should You Use?
For content creators: Use engagement by views. It reflects TikTok’s algorithm-driven nature.
For influencer marketing: Use engagement by followers when comparing creators with similar audience sizes.
For paid campaigns: Use engagement by reach to understand true unique user interaction.
If you’re producing automated short-form video content, tracking these metrics helps you understand which automated formats perform best.
What Counts as an Engagement on TikTok?
Not all interactions are created equal. Here’s what counts toward your TikTok engagement calculation:
Primary Engagement Metrics
Likes (Hearts) 💜
The most basic form of engagement. Easy to give, but still valuable. They signal approval and boost your content in the algorithm.
Comments 💬
Worth their weight in gold. Comments show deeper engagement and spark conversations. The algorithm loves videos that generate discussion.
Shares 🔄
The holy grail. When someone shares your video, they’re endorsing it to their network. Shares dramatically expand your reach and signal high-quality content to TikTok’s algorithm.
Saves (Bookmarks) 🔖
Often overlooked but incredibly valuable. Saves indicate your content has lasting value. Tutorial and educational content typically gets more saves.
Secondary Metrics That Influence Performance
While these don’t directly count in basic engagement calculations, they matter:
- Watch time and completion rate: Videos watched to the end get prioritized
- Profile visits: Shows interest beyond a single video
- Follows from video: The ultimate conversion metric
- Sound usage: When others use your audio
What Doesn’t Count
- Video views alone
- Profile views
- Impressions
- Duets and stitches (though they’re valuable for reach)
Understanding these distinctions helps you focus on the metrics that move the needle. When you’re learning how to create sound on TikTok, remember that viral sounds can drive engagement beyond your immediate content. TikTok Engagement Rate Benchmarks: What’s Good in 2026?
Context matters. A 5% engagement rate might be phenomenal for one creator and disappointing for another. Here’s how to benchmark your performance.
Engagement Rate by Follower Count
| Follower Range | Average Engagement Rate | Good Engagement Rate | Excellent Engagement Rate |
| 1K – 10K | 9-12% | 12-18% | 18%+ |
| 10K – 50K | 6-9% | 9-15% | 15%+ |
| 50K – 100K | 4-7% | 7-12% | 12%+ |
| 100K – 500K | 3-5% | 5-10% | 10%+ |
| 500K – 1M | 2-4% | 4-8% | 8%+ |
| 1M+ | 1-3% | 3-6% | 6%+ |
Notice the pattern? The bigger your audience, the harder it is to maintain high engagement rates. That’s normal and expected.
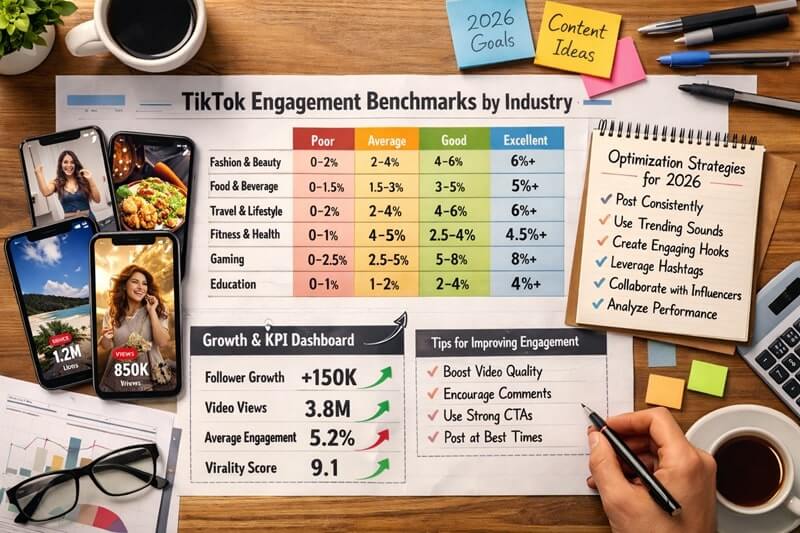
Industry-Specific Benchmarks
Different niches see different engagement patterns:
High-Engagement Niches:
- Comedy/Entertainment: 8-15%
- DIY/Crafts: 7-12%
- Fitness/Health: 6-11%
- Food/Cooking: 6-10%
Moderate-Engagement Niches:
- Fashion/Beauty: 4-8%
- Business/Marketing: 4-7%
- Technology: 3-6%
Lower-Engagement Niches:
- News/Politics: 2-5%
- Finance: 2-4%
These numbers aren’t judgments of quality. Some topics naturally generate more casual engagement, while others attract more passive viewers who still find value in the content.
Why Your Engagement Rate Might Be Lower Than Expected
You’re growing fast. Rapid follower growth often means lower engagement temporarily as your new audience settles in.
Algorithm changes. TikTok constantly tweaks its algorithm, which can impact engagement patterns.
Content inconsistency. Posting sporadically or changing your content style dramatically can confuse your audience.
Fake followers. If you’ve ever bought followers (don’t), they’ll tank your engagement rate.
Posting frequency. Ironically, posting too often can fatigue your audience and lower engagement per video.
For creators wondering how often to post on TikTok, the answer depends partly on maintaining healthy engagement rates.
Using Your Free TikTok Engagement Calculator
Ready to calculate your own engagement rate? Use the calculator below to instantly measure your TikTok performance across all three calculation methods.
🎯 TikTok Engagement Rate Calculator
All fields are optional. Enter what you have available.
How to Use the Calculator
- Enter your follower count (optional but recommended for comprehensive analysis)
- Input your video views from a specific video or you can add up across the last few posts (up to 9)
- Add engagement metrics: likes, comments, shares, and saves
- Click calculate to see your engagement rates using multiple methods
- Review the benchmark analysis to understand how you’re performing
The calculator shows you both engagement by views and engagement by followers, giving you a complete picture of your performance.
How to Improve Your TikTok Engagement Rate
Knowing your numbers is step one. Improving them is where the real work begins. Here are proven strategies to boost your TikTok engagement calculation results.
Create Hook-Driven Content
You have about 1-3 seconds to grab attention on TikTok. That’s it.
Your hook determines everything. Start with a question, a bold statement, or immediate value. “Here’s why you’re doing it wrong” beats “In today’s video” every single time.
The first frame matters too. Use text overlays, compelling visuals, or pattern interrupts to stop the scroll. Learn more about creating effective social media hooks that capture attention immediately.
Optimize Posting Times
Post when your audience is active. Check your TikTok analytics to see when your followers are online.
General best practices:
- Weekdays: 6-9 AM, 12-1 PM, 7-9 PM
- Weekends: 9-11 AM, 7-9 PM
But your audience might be different. Test different times and track engagement patterns.
Encourage Specific Actions
Don’t just hope for engagement. Ask for it strategically.
For comments: Ask questions, create polls in captions, or request opinions
For shares: Create save-worthy content (tutorials, tips, resources)
For saves: Make content people want to reference later
Avoid generic “like and follow” requests. Be specific about why someone should engage.
Use Trending Sounds and Hashtags
TikTok’s algorithm favors content that uses trending audio. But don’t force it. The sound should fit your content naturally.
Same with hashtags. Use a mix of:
- 2-3 trending hashtags
- 2-3 niche-specific hashtags
- 1-2 broad category hashtags
Engage With Your Audience
Respond to comments, especially in the first hour after posting. This signals to TikTok that your video is generating conversation.
Create response videos to interesting comments. This builds community and gives you endless content ideas.
Maintain Consistent Posting
Consistency beats perfection. The algorithm rewards accounts that post regularly.
Find a sustainable schedule—whether that’s once daily, three times weekly, or whatever you can maintain long-term. Sporadic posting confuses the algorithm and your audience.
Analyze and Iterate
Track your engagement rates weekly. Look for patterns:
- Which content types perform best?
- What video lengths get the most engagement?
- Do certain topics resonate more?
Double down on what works. Cut what doesn’t.
If you’re using tools like QuickVid to create content at scale, this data becomes even more valuable for optimizing your automated video strategy.
Advanced TikTok Engagement Metrics to Track

Basic engagement rate is just the beginning. Advanced creators track additional metrics for deeper insights.
Engagement Rate Per Post vs. Average
Don’t just calculate one video. Track your average engagement rate across your last 10-30 posts. This smooths out viral outliers and gives you a realistic baseline.
Formula:
Average Engagement Rate = Sum of all engagement rates ÷ Number of postsThis shows your true performance level and helps you spot trends over time.
Engagement Velocity
How quickly does your content gain engagement? Videos that get strong engagement in the first hour typically perform better overall.
Track:
- Engagement in first hour
- Engagement in first 24 hours
- Engagement after 48+ hours
Fast engagement velocity signals quality content to the algorithm.
Comment-to-Like Ratio
This reveals conversation quality. A high comment-to-like ratio (above 1:20) indicates your content sparks discussion.
Formula:
Comment Ratio = Comments ÷ LikesEducational and controversial content typically has higher comment ratios than entertainment content.
Share Rate
Shares are the most valuable engagement metric. They expand your reach exponentially.
Formula:
Share Rate = (Shares ÷ Views) × 100A share rate above 1% is excellent. Above 2% is exceptional.
Save Rate
Saves indicate lasting value. Tutorial, recipe, and educational content should aim for high save rates.
Formula:
Save Rate = (Saves ÷ Views) × 100A save rate above 2% shows your content has reference value.
Follower Conversion Rate
The ultimate metric: how many viewers become followers?
Formula:
Follower Conversion Rate = (New Followers ÷ Views) × 100A conversion rate above 0.5% is solid. Above 1% is excellent.
For creators exploring how much TikTok pays, remember that engagement metrics often matter more than view counts for monetization opportunities.
Common TikTok Engagement Calculation Mistakes to Avoid
Even experienced creators make these errors when calculating and interpreting engagement rates.
Mistake #1: Only Tracking Vanity Metrics
Views and followers look impressive. But they don’t pay the bills.
A creator with 500,000 followers and 2% engagement may earn less than a creator with 50,000 followers and 10% engagement. Brands know this. You should too.
Mistake #2: Comparing Across Different Calculation Methods
You can’t compare your 8% engagement by views to someone else’s 8% engagement by followers. They’re measuring different things.
Always clarify which calculation method you’re using when benchmarking.
Mistake #3: Ignoring Follower Count Context
A 5% engagement rate means something different for a 5,000-follower account versus a 500,000-follower account.
Always benchmark against accounts in your follower range, not just against any creator in your niche.
Mistake #4: Calculating Too Soon
Engagement continues to accumulate over time. Calculating your engagement rate 2 hours after posting gives you incomplete data.
Wait at least 24-48 hours before calculating engagement rates for meaningful insights.
Mistake #5: Not Tracking Trends Over Time
A single engagement rate is a snapshot. Tracking trends reveals the story.
Is your engagement increasing or decreasing? Are certain content types performing better? You can’t answer these questions with one-time calculations.
Using TikTok Engagement Data for Business Decisions
Engagement rates aren’t just numbers to obsess over. They’re business intelligence that should drive decisions.
For Content Creators
Identify your best content formats. Which videos consistently hit above-average engagement? Create more of those.
Optimize your content calendar. Schedule your best content types for your highest-engagement time slots.
Pitch to brands confidently. Lead with engagement rate, not follower count. Show brands you have an active, responsive audience.
Set realistic growth goals. If your current engagement rate is 4%, aim for 5% next month. Gradual improvement beats unrealistic targets.
For Marketers and Brands
Vet influencers properly. Don’t get dazzled by follower counts. Require engagement rate data before any partnership.
Calculate campaign ROI accurately. Use engagement rates to predict campaign performance and set realistic KPIs.
Identify micro-influencers. Often, creators with 10,000-50,000 followers and high engagement rates deliver better ROI than mega-influencers.
Benchmark your brand account. Compare your owned content performance to industry standards and adjust your strategy accordingly.
For Agencies
Create client dashboards. Track engagement rates alongside views and followers to show true performance.
Justify budget allocation. Use engagement data to show which content investments deliver results.
Identify collaboration opportunities. Find creators whose engagement rates indicate authentic audiences worth partnering with. When you’re managing multiple accounts or scaling content production with marketing automation tools, engagement metrics help you prioritize which content strategies deserve more resources.
Conclusion: Your TikTok Engagement Calculation Action Plan
TikTok engagement calculation isn’t complicated, but it is essential. Here’s your action plan to start using these insights today:
Step 1: Use the free calculator above to measure your current engagement rate across your last 10 videos.
Step 2: Benchmark your performance against the standards for your follower count and niche.
Step 3: Identify your top three performing videos. What do they have in common? Content type? Hook? Length? Topic?
Step 4: Set a realistic engagement rate goal for next month—typically 0.5-1% higher than your current average.
Step 5: Create a content experiment. Test one new variable (posting time, hook style, content format) while keeping everything else consistent.
Step 6: Track your engagement rate weekly. Look for trends, not just individual video performance.
Step 7: Double down on what works. When you find a content format or topic that consistently delivers above-average engagement, create more of it.
Remember: follower count impresses your friends. Engagement rate impresses brands and builds businesses.
Stop chasing vanity metrics. Start measuring what matters. Your engagement rate tells you whether you’re creating content that resonates or just adding to the noise.
Ready to create more engaging content consistently? Check out QuickVid’s automated video creation tools to produce high-quality TikTok content at scale while maintaining the authenticity that drives real engagement.
